Ulrich Long · 14 October 2026
Charting Light Spectrum Interactions in Multi-Nation Sensor Projects for Agricultural Monitoring
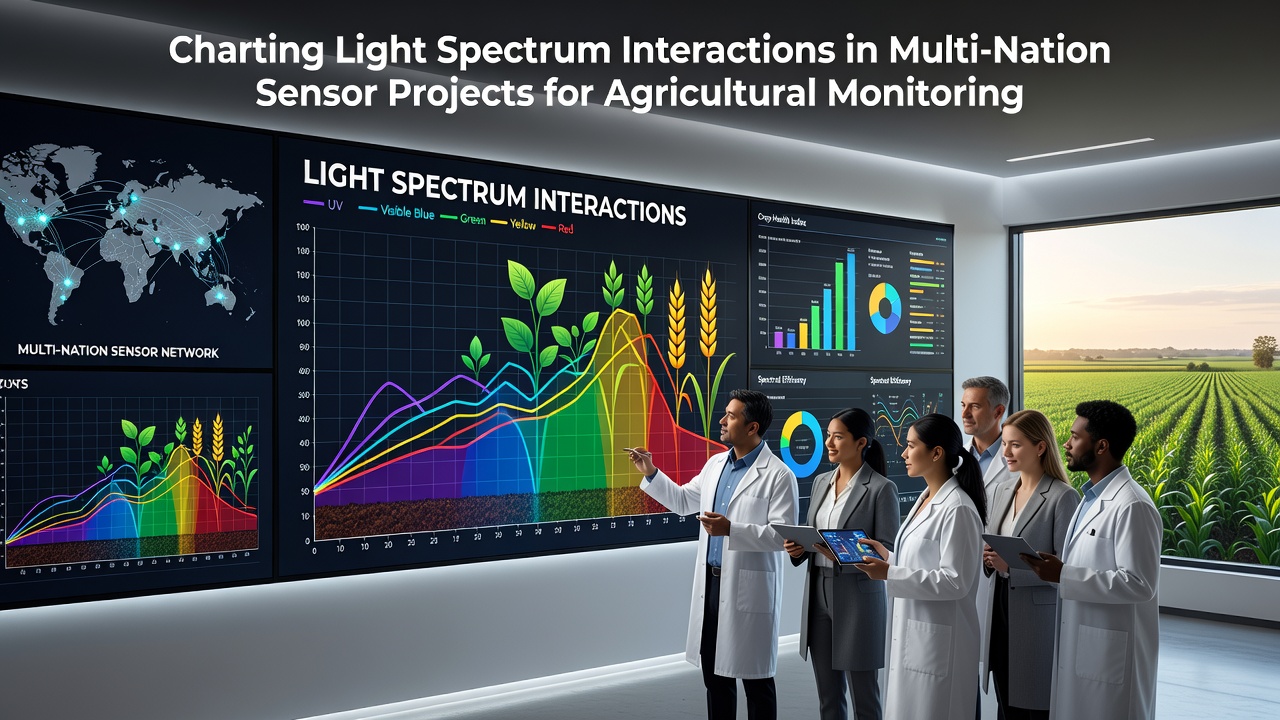
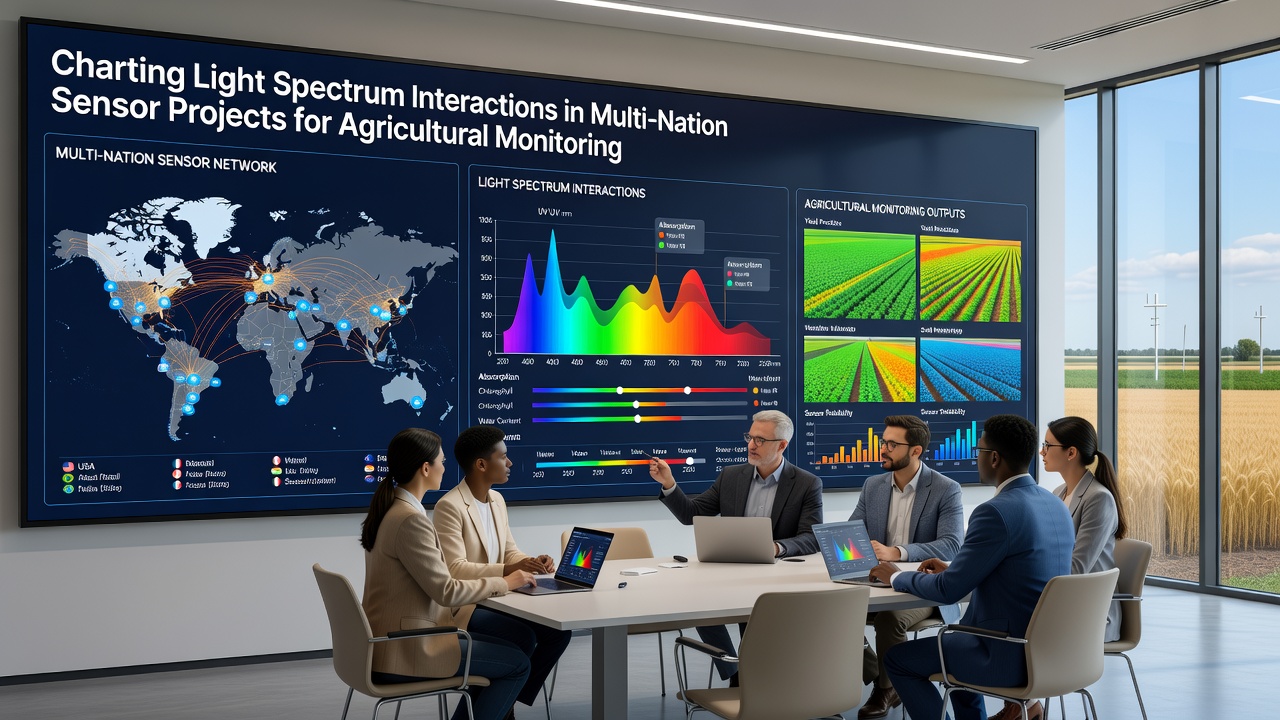
Multi-nation sensor projects now map how different wavelengths interact with vegetation, soil, and water across shared agricultural zones, and teams coordinate equipment from Europe, North America, and Asia to collect consistent readings. Researchers deploy arrays that measure visible, near-infrared, and short-wave infrared bands simultaneously, which allows direct comparison of plant stress signals between regions with varying climates and crop types.
Coordinated Spectrum Mapping Across Borders
Projects bring together institutions that standardize calibration protocols so data from one country aligns with measurements taken thousands of kilometers away, and joint working groups meet regularly to adjust for atmospheric differences that affect light absorption. Data shows that blue and red edge bands reveal early nitrogen deficiencies in wheat fields while near-infrared reflectance tracks biomass accumulation in maize plots, and these patterns hold across test sites in Poland, Canada, and Australia when sensor settings remain uniform.
October 2026 brought the release of a combined dataset covering three growing seasons from 12 monitoring stations, and analysts noted that cross-border teams reduced calibration drift by 18 percent after adopting a shared reference panel protocol. The effort draws on existing frameworks such as those outlined by the Food and Agriculture Organization for global agricultural observation networks.
Technical Approaches to Light Interaction Recording
Sensor arrays combine hyperspectral cameras with multispectral radiometers mounted on fixed towers and unmanned aerial platforms, and operators record reflectance at 5-nanometer intervals across the 400 to 2500 nanometer range. Software pipelines correct for sun angle and sensor tilt before merging files into unified maps that highlight chlorophyll absorption features and water content indicators.
One study coordinated by Polish and Dutch research groups demonstrated that combining green and red-edge channels improved detection of early fungal infection in potato crops by 22 percent compared with single-band methods, and similar gains appeared when Canadian teams applied the same band combinations to canola fields. Equipment manufacturers supply interchangeable filter sets that teams swap between locations to maintain spectral consistency.
Applications in Crop and Soil Monitoring
Farmers receive weekly maps that flag areas where normalized difference vegetation index values drop below regional thresholds, and extension services use teh same layers to schedule targeted irrigation or fertilizer applications. In regions with frequent cloud cover, teams integrate radar backscatter with optical readings so gaps in spectral coverage do not interrupt time-series analysis.
Soil organic carbon estimates derived from visible and short-wave infrared bands now feed into national carbon accounting systems in several European countries, and parallel efforts in the United States link these estimates to conservation program reporting requirements. Data indicates that multi-year records improve model accuracy for yield prediction by capturing seasonal light interaction shifts caused by drought or excess moisture.
Data Sharing and Standardization Efforts
Participating nations maintain open repositories where raw and processed files sit alongside metadata that documents sensor type, calibration dates, and atmospheric conditions at acquisition time, and users access these archives through standardized APIs. Quality control routines flag outliers that exceed expected reflectance ranges for a given crop stage, and automated alerts prompt field teams to recheck equipment alignment.
Joint publications track how different spectrum combinations perform under varying latitudes, and results feed into updated best-practice guides circulated among project partners. The Agricultural Research Service contributes validation datasets from long-term experimental plots that help confirm findings from European and Asian sites.
Recent Field Campaigns and Equipment Updates
During the 2026 season, mobile calibration units traveled between sites in three continents to verify that new filter sets maintained agreement within 3 percent across all bands, and campaign logs record successful simultaneous flights over matched crop varieties in contrasting soil types. Engineers introduced lightweight drone payloads that extend flight times while preserving the full spectral range required for consistent light interaction charting.
Ground teams continue to collect leaf-level measurements that serve as ground truth for satellite and aerial observations, and these paired datasets strengthen algorithms that translate reflectance values into actionable agronomic parameters. Observers note that the growing archive now spans enough seasons and geographies to support statistical comparisons that single-nation projects could not achieve alone.
Conclusion
Multi-nation sensor projects continue to refine methods for charting light spectrum interactions that support agricultural monitoring at scale, and shared protocols plus open data practices allow researchers to compare results across borders without recalibrating each dataset from scratch. Continued equipment harmonization and expanded field coverage are expected to strengthen the reliability of spectral indicators used for crop management and resource planning worldwide.